
Kern County Ranks Among California’s Most Dangerous Places to Ride a Bike. New Local Data Explains Why.
August 5, 2026 | Article by Chain | Cohn | Clark staff Social Share

A new analysis has confirmed what cyclists in Bakersfield have known for years: riding a bike in Kern County carries risks that exceed most of the state, and the numbers are getting worse, not better.
Kern County ranks among California’s top ten counties for cyclist fatalities, according to recently published data covered by local news outlets . The ranking places Kern alongside counties with significantly larger populations and denser urban cores, a troubling distinction for a region where cycling infrastructure has historically lagged behind the pace of the city’s growth.
For a county that does not have the sheer volume of cyclists found in Los Angeles or the Bay Area, a top-ten fatality ranking reflects an elevated per-rider risk that the data makes difficult to explain away.
Chain | Cohn | Clark has tracked bicycle crash data in Bakersfield for years. What the firm’s own analysis of local crash records shows — drawn from the Transportation Injury Mapping System, SafeTREC, and SWITRS — reinforces the statewide picture with a level of local detail that should concern every cyclist, every parent, and every driver sharing Kern County roads.
“The trend we are seeing now is not a blip. It is a pattern,” said Matt Clark, managing partner and attorney at the law Office of Chain | Cohn | Clark. “Kern County has a bicycle safety problem that is measurable, documentable, and in too many cases, entirely preventable.”
What the Statewide Ranking Means for Kern County
California tracks cyclist fatalities by county, and Kern’s consistent presence in the top ten is notable for reasons that go beyond the raw numbers. Fatality rankings of this kind account for the scale of cycling activity, meaning a county does not crack the top ten simply by having more people on bikes. It gets there by having crashes that are more likely to turn fatal, a pattern driven by road design, vehicle speeds, infrastructure gaps, and driver behavior.
Residents and local experts interviewed by 23ABC News pointed to familiar culprits: wide arterial roads designed for high-speed vehicle traffic, limited protected cycling infrastructure, and driver behaviors that consistently put cyclists at risk. The corridors where crashes concentrate in Bakersfield are not obscure side streets. They are the major arterial roads that connect neighborhoods to employment centers, schools, transit stops, and commercial areas, the same roads that many residents who depend on cycling have no alternative but to use.
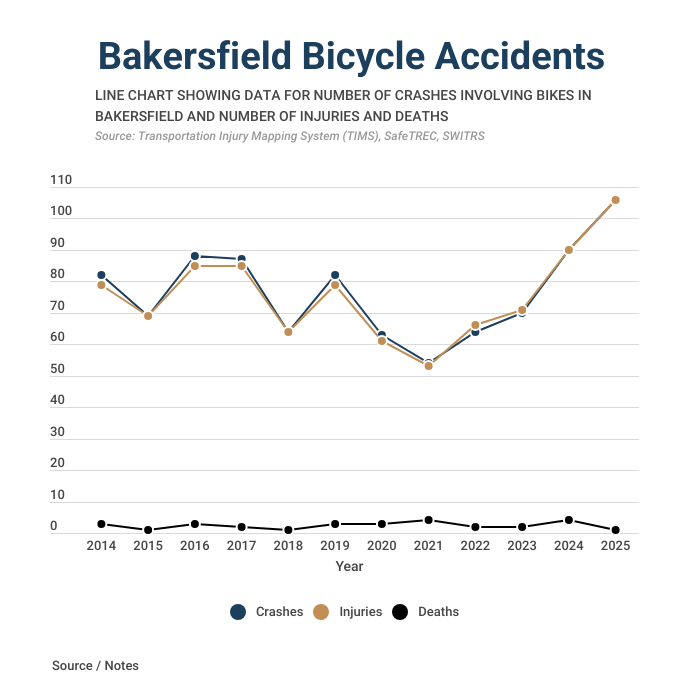
The statewide ranking arrives at a moment when Bakersfield’s own local crash data is trending in the wrong direction. According to Chain | Cohn | Clark’s analysis of TIMS, SafeTREC, and SWITRS records, Bakersfield recorded approximately 106 bicycle crashes in 2025, the highest single-year total going back to at least 2014. That figure surpasses the previous peaks of the mid-to-high eighties recorded in 2016 and 2017, and represents a sharp acceleration from the relative lows seen during and immediately after the pandemic years.
Injuries tracked closely with crashes throughout the decade-long dataset. While fatalities in 2025 were lower than some prior years, the combination of record crash volume and Kern County’s statewide fatality ranking paints a picture that neither statistic tells fully on its own.
When Crashes Are Happening
Chain | Cohn | Clark’s analysis of the 2025 crash data includes a breakdown by day of week and time of day that reveals where risk is most concentrated for Bakersfield cyclists.
The late afternoon and early evening hours, roughly 3pm through 9pm, account for a significant share of crashes across nearly every day of the week. This window aligns with the evening commute period, when vehicle traffic is at or near its daily peak and light conditions are transitioning from full daylight toward dusk. Wednesday afternoon between 3-6pm recorded the single highest concentration in the dataset, with six crashes in that window alone.
Friday morning between 6-9am also stands out, with five crashes recorded during the pre-workday commute rush. Monday and Tuesday midday hours showed elevated numbers as well. Saturday’s midday window recorded four crashes, reflecting recreational cycling activity on a day when traffic patterns are less predictable.
The pattern is consistent with what traffic safety researchers document nationally. Cyclists are most vulnerable when they share roads with the highest concentration of vehicles, and when drivers transitioning between light conditions may be slower to register a cyclist’s presence. Evening hours on busy arterial roads, where Bakersfield’s infrastructure provides minimal separation between bicycles and high-speed vehicle traffic, represent the highest-risk environment the local data identifies.
Why Crashes Are Happening
The violation breakdown from Chain | Cohn | Clark’s analysis of 2025 crash data provides the most direct evidence of causation. Of the 106 crashes recorded, the single largest primary collision factor was wrong side of road, accounting for 30% of all crashes. Nearly one in three bicycle crashes in Bakersfield last year involved a party traveling on the wrong side of the road.
The second largest category was traffic signals and signs violations, accounting for 22% of crashes, followed by improper turning at 19% and automobile right-of-way violations at 15%. Unsafe speed was the primary factor in 5% of crashes. Lighting violations were coded in 2%, and driving or bicycling under the influence accounted for another 1%.
The violation profile is significant because it locates the primary source of risk in driver behavior rather than cyclist behavior. Wrong-side-of-road violations, improper turning, failure to yield right of way, and traffic signal violations are all categories where a driver’s decision, or failure to make one, places a cyclist in immediate danger with little or no warning and minimal ability to avoid a collision.
“When you combine that with the right-of-way violations and the improper turns, you are looking at a situation where cyclists are being put in danger by decisions being made inside vehicles,” Clark said. “That has legal consequences, and families should understand what those consequences are.”
The Infrastructure Context
The statewide fatality ranking and the local crash data exist within a broader infrastructure context that shapes both the frequency and severity of bicycle crashes in Kern County.
Bakersfield’s road network was developed during an era of automobile-centric planning, and its major arterial corridors reflect that history. Wide lanes, high posted speeds, and limited physical separation between vehicle traffic and cyclists create conditions that amplify the consequences of driver errors. When a driver on a 45-mile-per-hour arterial makes an improper turn or fails to yield, the outcome for a cyclist is categorically different from the same error on a lower-speed residential street.
The 2025-26 Kern County Grand Jury report on traffic calming, released earlier this year, documented significant staffing constraints within Bakersfield’s Public Works Traffic Engineering Division. The report found that the division has operated with essentially the same number of engineers for more than 26 years, despite the city’s population growing by more than 71% during that period. A department stretched that thin is limited in its ability to proactively identify dangerous cycling corridors, advocate for infrastructure improvements, or respond quickly when residents raise safety concerns.
Those systemic gaps affect cyclists directly. Faded or missing bike lane markings, inadequate lighting at high-risk intersections, and arterial road designs that place cyclists in conflict with turning vehicles are all conditions that a better-resourced traffic engineering function might address before the crash data forces the issue.
California Law and What Cyclists Are Owed
California law provides meaningful protections for cyclists, and understanding those protections is important both for riders and for families dealing with the aftermath of a crash.
Drivers in California are required to maintain a minimum three-foot clearance when passing a cyclist. They must yield to cyclists in bike lanes before making right turns. They are prohibited from opening vehicle doors into the path of oncoming bicycle traffic. When a driver’s violation of any of these rules contributes to a crash that injures a cyclist, that violation establishes the legal foundation of a negligence claim.
California’s comparative fault system means that even if a cyclist contributed to a crash in some way, they may still recover compensation proportional to the other party’s degree of fault. Insurance companies frequently attempt to shift blame onto injured cyclists, citing factors like riding position, equipment, or behavior in the moments before impact. The violation data from Bakersfield’s 2025 crashes, showing that driver behavior accounts for the overwhelming majority of primary collision factors, provides important context for evaluating those arguments.
Government liability is also relevant when crashes occur on roads with documented infrastructure deficiencies. Missing or inadequate bike lane markings, poor lighting at known high-risk intersections, and road designs that create predictable conflicts between cyclists and turning vehicles can support claims against the public agencies responsible for maintaining safe road conditions. These claims are subject to strict deadlines in California, including a six-month window to file a government tort claim from the date of injury. Missing that deadline can permanently eliminate an otherwise valid claim.
“The law in California is actually quite protective of cyclists,” Clark explained. “The challenge is that injured cyclists and their families often do not know what their rights are, and they do not know how quickly evidence can disappear after a crash. The sooner someone contacts an attorney after a bicycle crash, the better the position they are in to pursue what they are actually owed.”
What the Data Demands
The combination of Kern County’s statewide fatality ranking and Bakersfield’s record-high 2025 crash total makes a straightforward case: bicycle safety in this community is a serious and worsening problem that warrants serious attention.
Residents interviewed by local news outlets following the statewide ranking release pointed to the need for more protected cycling infrastructure, better enforcement of traffic laws in corridors where cyclists are most concentrated, and broader public awareness of driver obligations toward cyclists. Those are the kinds of community-level responses that have reduced cyclist fatalities in other California cities where similar conditions once existed.
For individual cyclists, the time-of-day data from Chain | Cohn | Clark’s analysis offers practical guidance. The late afternoon and early evening hours represent the highest-risk windows by a significant margin. Lights, reflective gear, and maximizing visibility during those hours are concrete steps that the data supports. Intersection awareness, particularly at intersections where turning vehicles are present, addresses the primary violation categories driving the most crashes.
For the broader community, the responsibility for reducing these numbers rests with more than individual cyclists making individual choices. The drivers whose violations account for the majority of Bakersfield’s 2025 bicycle crashes, the planning decisions that produced road infrastructure without meaningful cyclist protection, and the enforcement and engineering gaps that allow dangerous conditions to persist are community-level problems that require community-level responses.
———
MEDIA COVERAGE
- Kern County ranks in California’s top 10 for cyclist fatalities; residents and experts weigh in (23ABC News)
———
If you or someone you know is injured in an accident at the fault of someone else, or injured on the job no matter whose fault it is, contact the attorneys at Chain | Cohn | Clark by calling (661) 323-4000, or fill out a free consultation form, text, or chat with us at chainlaw.com.

